Navigating Volatility Lab

VOLATILITY LAB
Navigating Market Volatility

Our comprehensive kit of options volatility tools provides a snapshot of past and future readings for volatility on a stock, its industry peers and some measure of the broad market.
Already a Client?
Learn more about Volatility Lab from our Traders' Academy.
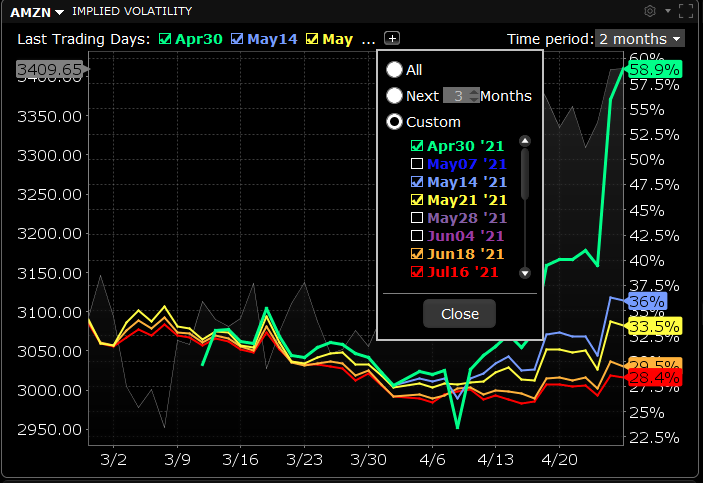
Implied Volatility
Implied Volatility plots the anticipated volatility of the selected stock using the prevailing option premium. See at a glance whether or not implied volatility is relatively high in any given month, possibly caused by expected earnings announcements or uncertainty over possible changes to dividend payments.
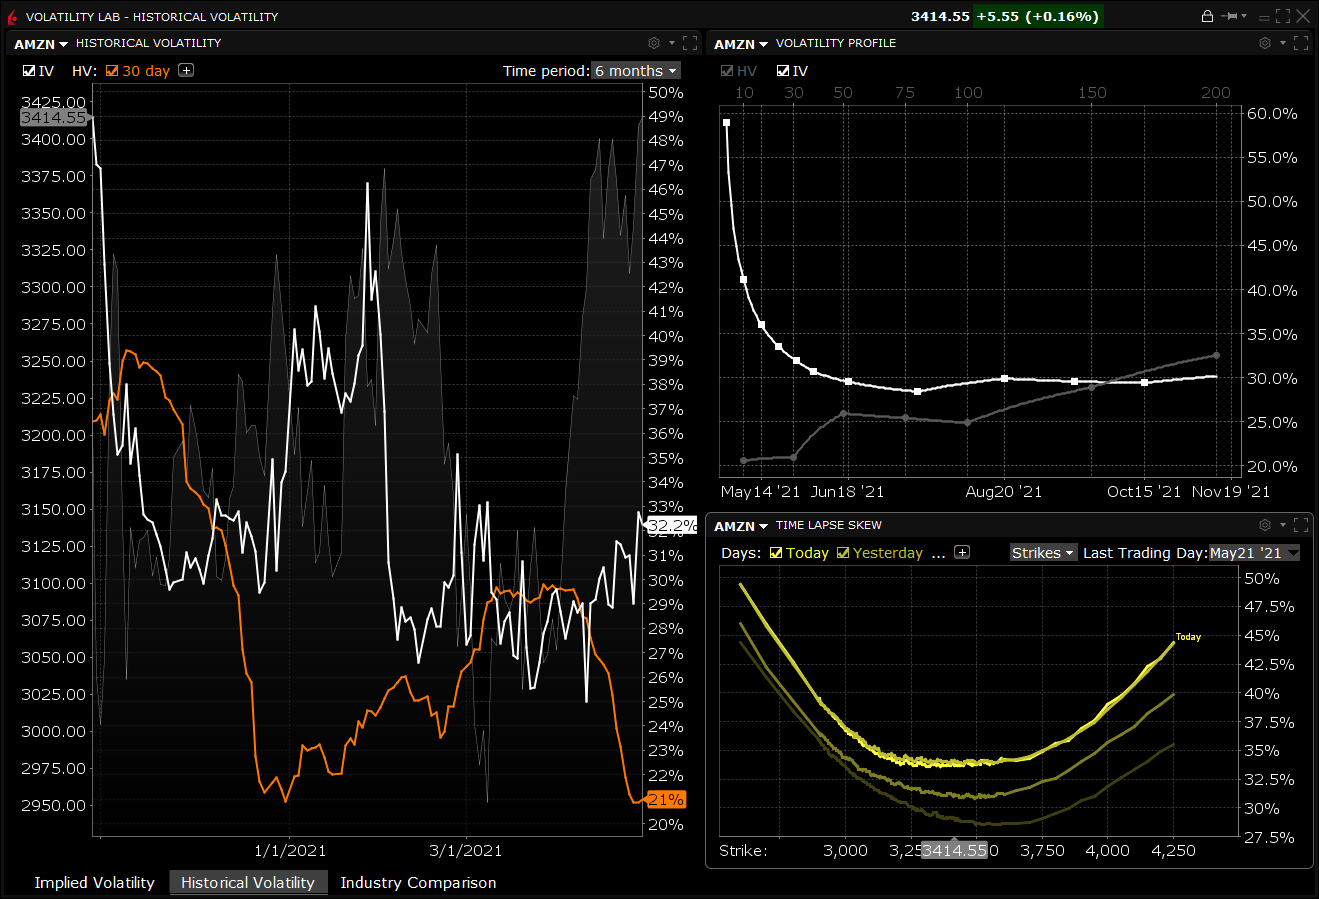
Historical Volatility
The Historical Volatility plots a 30-day reading of both implied and historical volatility against the share price over custom period that you define. A light gray line in the background plots the reading for the underlying share price.
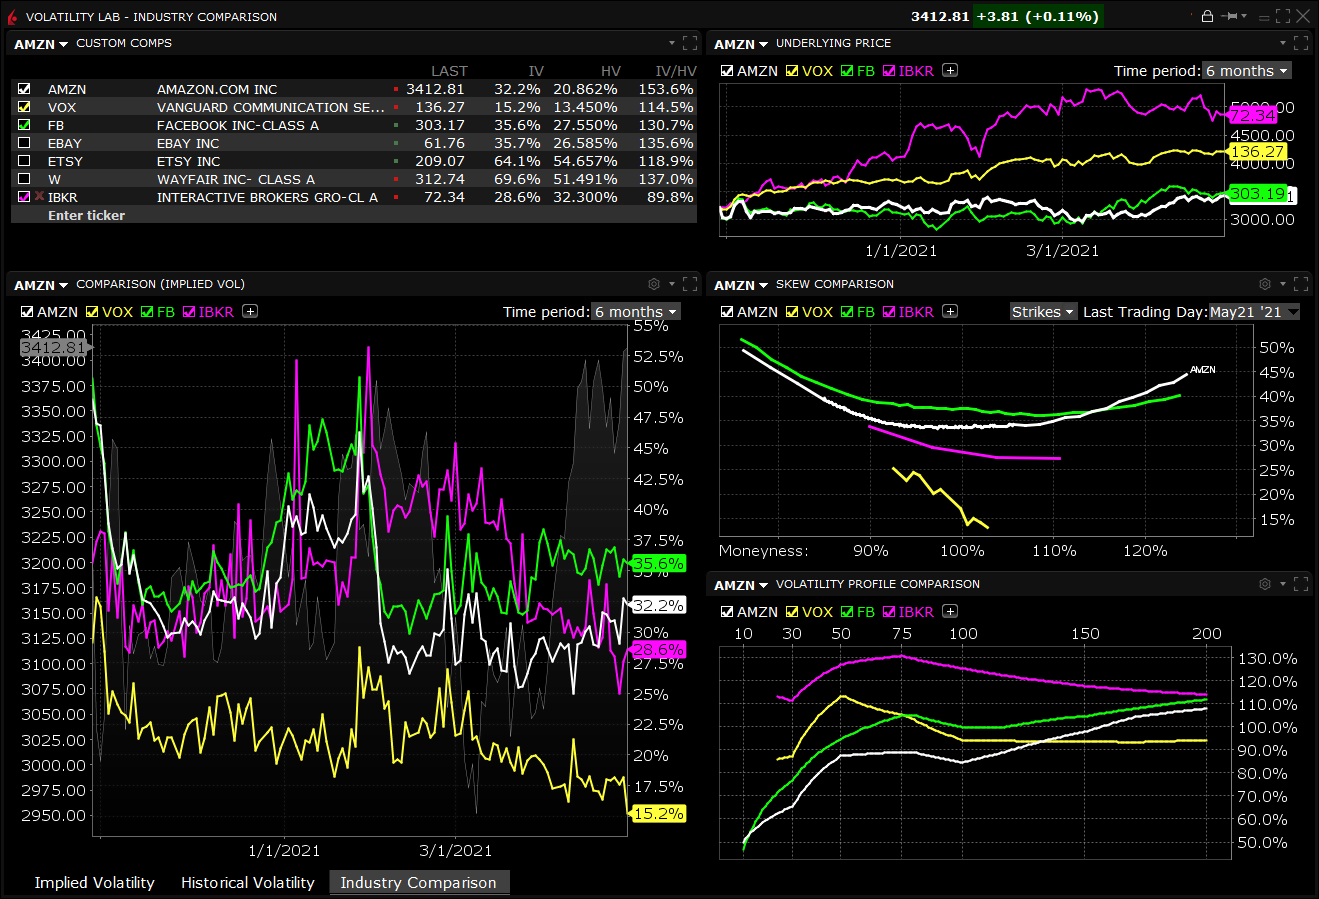
Industry Comparisons
See how your selected stock’s volatility measures up against the volatility of comparable companies in the same industry in the Industry Comparison tab.
USER GUIDES
Get Started with Volatility Lab
For more information on Volatility Lab, select your trading platform.